Wednesday, March 27, 2024

Weather. Or Knot.

A while back I started using Rasberry Pi systems to monitor environmental data around the house. I tried several "hats" that included different sensors. Most read temperature; some could check humidity, luminosity, and barometric pressure, allegedly.

The sensors I ended up liking the most connect to the Pi via the SparkFun QWIIC connection. The "all-in-one" sensors suffered by being too close to the Pi CPU, necessitating adjustments to the readings to compensate for the excess heat. Putting sensors just an inch or 2 away (5 cm) avoided that.

After getting ambient in-house temperature readings and placing sensors in places like the water heater pipes and the clothes dryer door let me check out energy efficiency, in a way. Or just seeing when and for how long we use high energy appliances. The local electric utility has hourly metrics I can download; a data acquisition story for another time.

With inside conditions measured I thought about putting a Pi sensor outside, and got as far as placing one temperature sensor in a window. But that is only on the edge of "outside" and gets some heat from the building instead of the atmosphere. I looked at getting a full-fledged weather station [ see: https://blog.netbsd.org/tnf/entry/the_geeks_way_of_checking ], then decided the investment wasn't necessary. There's a full-fledged airport meteorological station at a nearby airport which publishes ambient conditions that suit my needs [Insert George Carlin's joke about airport weather: nobody cares about the airport; downtown is on fire!].

Among other published data streams, there is a set that has evolved from early web days of FTP content into HTML pages that contain plain text (and bear "ftp" in their URL).

The site I am using is "KMTN"; many many others are there for the browsing. A few hundred sites have data not updated since 2008, interestingly.

Yes, you could use curl or wget, but I like Lynx:

# get metar data into a file

/usr/pkg/bin/lynx -dump https://tgftp.nws.noaa.gov/data/observations/metar/decoded/${SITE}.TXT > $DATAFILE

This file looks like:

Baltimore / Martin, MD, United States (KMTN) 39-20N 076-25W
Mar 27, 2024 - 01:57 PM EDT / 2024.03.27 1757 UTC
Wind: from the S (180 degrees) at 3 MPH (3 KT):0
Visibility: 2 mile(s):0
Sky conditions: overcast
Weather: heavy rain
Temperature: 46 F (8 C)
Dew Point: 44 F (7 C)
Relative Humidity: 93%
Pressure (altimeter): 30.19 in. Hg (1022 hPa)
ob: KMTN 271757Z 18003KT 2SM +RA OVC009 08/07 A3019
cycle: 18

Handy text data with a plethora of environmental conditions. The "ob" character string has some of this data of interest to pilots.

Zabbix


When I hooked up different Pi hats they typically included some code to gather the data, and I found ways to push/pull the data into a Zabbix monitoring suite. I leveraged published templates that included a variety of readings under one umbrella. The Sparkfun template came from?

I borrowed a shell script logic flow from Bernhard Linz:


# Script for Monitoring a Raspberry Pi with Zabbix
# 2013 Bernhard Linz
# Bernhard@znil.de / http://znil.net
#
# Sat Feb  5 15:12:21 UTC 2022 : translation from Linux to NetBSD
# Tue Jul  5 21:05:42 UTC 2022 : back to suse
# Sun Jul 17 01:50:10 AM UTC 2022 : sparkfun

A Sparkfun template from 2022:

<?xml version="1.0" encoding="UTF-8"?>
<zabbix_export>
    <version>5.0</version>
    <date>2022-11-04T20:48:52Z</date>
    <groups>
        <group>
            <name>RaspberryPi</name>
        </group>
    </groups>
    <templates>
        <template>
            <template>Sparkfun</template>
            <name>Sparkfun</name>
            <description>Pi Hat with display</description>
            <groups>
                <group>
                    <name>RaspberryPi</name>
                </group>
[...]

When I started working on code to push airport conditions into Zabbix I decided to use the trapper mechanism, set up individual items as environmental parameters and ignored the idea of a template. That was fine for just one Zabbix system, and probably okay for a 2-system landscape, but when I decided to add a third, I realized copying the definitions to another system wasn't as easy as exporting a template and importing it into another system. And expanding the set made it more complex. I looked at template definitions inside Zabbix itself, finding an obscure reference to a template generator, a dead end for me (Template tooling version used: 0.38). I figured I would hand roll a template from the many examples.

All the way back to Zabbix 2.0 was this handy sample:


After a bit of trial-and-error I created a workable import file; the main difficulty was complaints if I copied one item to another without altering the UUID. There's probably a better way. Once I had items representing the airport conditions I was already gathering I added others that could be interesting, leaving out things like "ceiling". An extract follows:

<item>
    <uuid>9d798f42e46b450f85edd27c0bb83ae7</uuid>
    <name>Ambient Wind Speed</name>
    <type>TRAP</type>
    <key>enviro[Wind.Speed]</key>
    <delay>0</delay>
    <value_type>FLOAT</value_type>
    <units>MPH</units>
    <description>Ambient Wind Speed in MPH</description>
    <tags>
        <tag>
            <tag>Application</tag>
            <value>Environment</value>
        </tag>
    </tags>
</item>

<item>
    <uuid>9d798f42e46b450f85edd27c0bb83ae6</uuid>
    <name>Ambient Wind Direction in Degrees</name>
    <type>TRAP</type>
    <key>enviro[Wind.Direction]</key>
    <delay>0</delay>
    <value_type>UNSIGNED</value_type>
    <units>degrees</units>
    <description>Ambient Wind Direction in Degrees</description>
    <tags>
        <tag>
            <tag>Application</tag>
            <value>Environment</value>
        </tag>
    </tags>
</item>

<item>
    <uuid>9d798f42e46b450f85edd27c0bb83af6</uuid>
    <name>Ambient Wind Direction N-S-W-E Compass Rose</name>
    <type>TRAP</type>
    <key>enviro[Wind.Rose]</key>
    <delay>0</delay>
    <value_type>TEXT</value_type>
    <description>Ambient Wind Direction Rose</description>
    <tags>
        <tag>
            <tag>Application</tag>
            <value>Environment</value>
        </tag>
    </tags>
</item>

I like this example as it includes float, unsigned, and text, to check if data transforms and transfers work as intended. The "key" is the critical design component for storing and retrieving values. I decided to include everything under one array, and name the pointers with capitals, separating similar parameters with a period, so the wind values start with "Wind.". Other conventions include dashes, or just characters.

Because the airport team updates their site hourly that is the data resolution; collecting more than once per hour would generate flat lines between the hours, and fill the database with redundancies. I set up one cron job to pull the data and one to push it into Zabbix. There are probably some error conditions I should trap, like with FIOS is not working as it should.

CRON


[ ... ] parse-metar.sh >load-metar.sh

The parse phase is a set of grep commands, followed by sed, then awk, based on the data file retrieved first.


The lines for the 3 wind values:

grep  "^Wind: " $DATAFILE  | sed -e "s/(//g" -e "s/)//g" | awk '{print ""ENVIRON["ZABBIX_SEND"]" enviro[Wind.Rose]                               -o " $4}'
grep  "^Wind: " $DATAFILE  | sed -e "s/(//g" -e "s/)//g" | awk '{print ""ENVIRON["ZABBIX_SEND"]" enviro[Wind.Direction]                          -o " $5}'
grep  "^Wind: " $DATAFILE  | sed -e "s/(//g" -e "s/)//g" | awk '{print ""ENVIRON["ZABBIX_SEND"]" enviro[Wind.Speed]                              -o " $8}'

To make the script a little tidier, this version puts the zabbiz_sender command into an environment variable. Others might use a Bash-ism... The trickiest part was capturing the cryptic observation codes with embedded spaces, as multiple values need to be quoted for Zabbix to store properly.

export ZABBIX_SEND="/usr/pkg/bin/zabbix_sender -vv -z "${ZABBIX_SERV}" -p 10051 -s "${ZABBIX_HOST}" -k "

The server is the Zabbix system, and the host is the system in Zabbix that gets the data. It could be any system; I chose a file server as quite likely to stay available most of the time.

The load script is the standard output from the parse phase. Again. little error checking; if the data file doesn't exist the load fails and leaves a gap in the record.

LOAD


If everything works, the load into Zabbix shows 1 processed per record:

zabbix_sender [22659]: DEBUG: answer [{"response":"success","info":"processed: 1; failed: 0; total: 1; seconds spent: 0.000018"}]
Response from "zab.bix:10051": "processed: 1; failed: 0; total: 1; seconds spent: 0.000018"
sent: 1; skipped: 0; total: 1

TEMPLATE

Here is how my environmental template looks now:

Zabbix template screen shot

Adding additional keys to the template did not include them in the host if a prior version was used, but deleting and re-adding the template seemed to work.

GRAPHS


One "interesting" flaw I noticed when viewing graphs of the measurements was duplicate Y-axis values.
I saw this in Zabbix 6.0, 6.2 and 6.4; the later versions have improved axes labeling with color differentiators for "top of the hour" moments.


6.0


6.4
If the Y range is large enough, the values are distinct. A close-up of the values when too close together:


Maybe there is a bug report on this; haven't looked yet.

VERSIONS


I've gone backwards in Zabbix versions after getting 6.2 and 6.4 working on FreeBSD, because I wanted to use NetBSD, which has 6.0 in pkgsrc applications. I've not found too many obstacles moving definitions among the versions, where the bigger challenge is changes in layout or other user experience factors. "Configuration" is now "Data Collection".

The FreeBSD port can be found in /usr/ports/net-mgmt/zabbix64-server. For NetBSD the package source (pkgsrc) is under /usr/pkgsrc/sysutils/zabbix60-server.  The pkgsrc site has a "work in progress" of Zabbix 6.4: https://wip.pkgsrc.org/cgi-bin/gitweb.cgi?p=pkgsrc-wip.git;a=tree;f=zabbix64-server;hb=HEAD Oddly, the https://pkgsrc.se/sysutils view only shows through Zabbix 6,0.

The "knot" joke in the post title is that I skipped over wind speed in knots, not being a son of a son of a sailor.

Monday, March 25, 2024

NetBSD 10 Beta, RC1-6 and Pi Wifi and A/V

 Complex title, just to say how stable and feature-rich is NetBSD 10 on a Raspberry Pi (4)?

Pretty good, not bad, can't complain.


Wireless

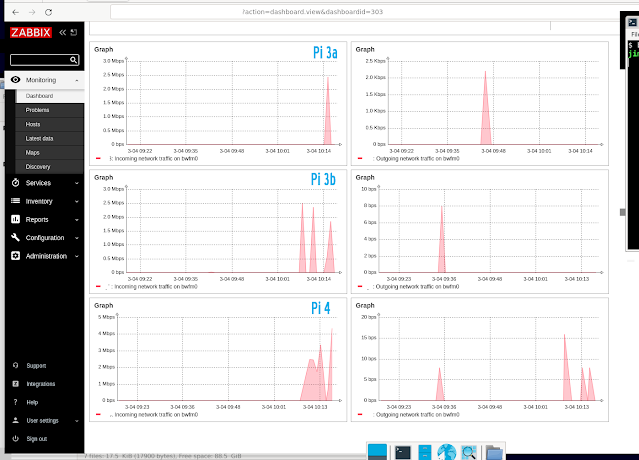
At one time during RC (release candidate) testing I had wi-fi engaged on a Pi 3A, a 3B, and a 4. Beyond those, the Pi0W and Pi02W wireless has been unflappable on start-up, if a bit squeezed on speed, and an occasional miss of the beat. Since I took this screenshot, the 4 has lost the ifconfig (again), and the 2 3's are humming along. All of those are on the same GENERIC64 kernel.

Reply from 192.168.1.39: bytes=32 time=4ms TTL=255


Scanning color slides at 1600 dpi off a Pi:


I know there is a "symlink" fix supposed to repair the lost wireless interface; see below.

GOOD?:
Mar 11 15:06:54 arm64 /netbsd: [   1.4005357] bwfm0 at sdmmc0 function 1
Mar 11 15:06:54 arm64 /netbsd: [   2.8833895] bwfm0: Firmware file default:    brcmfmac43455-sdio.bin
Mar 11 15:06:54 arm64 /netbsd: [   2.8833895] bwfm0: Firmware file model-spec: brcmfmac43455-sdio.Raspberry Pi 4 Model B.bin
Mar 11 15:06:54 arm64 /netbsd: [   2.8833895] bwfm0: Found Firmware file: brcmfmac43455-sdio.bin
Mar 11 15:06:54 arm64 /netbsd: [   2.8905571] bwfm0: NVRAM file default:    brcmfmac43455-sdio.txt
Mar 11 15:06:54 arm64 /netbsd: [   2.8905571] bwfm0: NVRAM file model-spec: brcmfmac43455-sdio.Raspberry Pi 4 Model B.txt
Mar 11 15:06:54 arm64 /netbsd: [   2.8905571] bwfm0: autoconfiguration error: NVRAM file not available
Mar 11 15:06:54 arm64 /netbsd: [   2.8905571] bwfm0: CLM file default:    brcmfmac43455-sdio.clm_blob
Mar 11 15:06:54 arm64 /netbsd: [   2.8905571] bwfm0: CLM file model-spec: brcmfmac43455-sdio.Raspberry Pi 4 Model B.clm_blob


BAD:
Mar 21 22:05:32 nb4 /netbsd: [   1.3996878] bwfm0 at sdmmc0 function 1
Mar 21 22:05:32 nb4 /netbsd: [   3.6135988] bwfm0: Firmware file default:    brcmfmac43455-sdio.bin
Mar 21 22:05:32 nb4 /netbsd: [   3.6135988] bwfm0: Firmware file model-spec: brcmfmac43455-sdio.Raspberry Pi 4 Model B.bin
Mar 21 22:05:32 nb4 /netbsd: [   3.6197181] bwfm0: Found Firmware file: brcmfmac43455-sdio.bin
Mar 21 22:05:32 nb4 /netbsd: [   3.6197181] bwfm0: NVRAM file default:    brcmfmac43455-sdio.txt
Mar 21 22:05:32 nb4 /netbsd: [   3.6197181] bwfm0: NVRAM file model-spec: brcmfmac43455-sdio.Raspberry Pi 4 Model B.txt
Mar 21 22:05:32 nb4 /netbsd: [   3.6197181] bwfm0: autoconfiguration error: NVRAM file not available
Mar 21 22:05:32 nb4 /netbsd: [   3.6197181] bwfm0: CLM file default:    brcmfmac43455-sdio.clm_blob
Mar 21 22:05:32 nb4 /netbsd: [   3.6197181] bwfm0: CLM file model-spec: brcmfmac43455-sdio.Raspberry Pi 4 Model B.clm_blob

When it works:

genet0: flags=0x8843<UP,BROADCAST,RUNNING,SIMPLEX,MULTICAST> mtu 1500
        ec_capabilities=0x1<VLAN_MTU>
        ec_enabled=0
        address: []
        media: Ethernet autoselect (1000baseT full-duplex)
        status: active
        inet6 [] flags 0 scopeid 0x1
        inet 192.168.1.2/24 broadcast 192.168.1.255 flags 0
lo0: flags=0x8049<UP,LOOPBACK,RUNNING,MULTICAST> mtu 33624
        status: active
        inet6 ::1/128 flags 0x20<NODAD>
        inet6 fe80::1%lo0/64 flags 0 scopeid 0x2
        inet 127.0.0.1/8 flags 0
bwfm0: flags=0x8843<UP,BROADCAST,RUNNING,SIMPLEX,MULTICAST> mtu 1500
        ssid [] nwkey *****
        powersave off
        bssid [] chan 11
        address: []
        media: IEEE802.11 autoselect (HT mode 11ng)
        status: active
        inet6 []%bwfm0/64 flags 0 scopeid 0x3
        inet 192.168.1.1/24 broadcast 192.168.1.255 flags 0

Firmware/devices seems fresh:

$ ls -l /boot/dtb/broadcom/
-r-xr-xr-x  1 root  wheel  37735 Mar 12 10:19 bcm2711-rpi-4-b.dtb
-r-xr-xr-x  1 root  wheel  37679 Mar 12 10:19 bcm2711-rpi-400.dtb
-r-xr-xr-x  1 root  wheel  20741 Mar 12 10:19 bcm2837-rpi-3-a-plus.dtb
-r-xr-xr-x  1 root  wheel  21610 Mar 12 10:19 bcm2837-rpi-3-b-plus.dtb
-r-xr-xr-x  1 root  wheel  21142 Mar 12 10:19 bcm2837-rpi-3-b.dtb
-r-xr-xr-x  1 root  wheel  20465 Mar 12 10:19 bcm2837-rpi-cm3-io3.dtb

A recent mail message contains the sym-fix:
"
In this image, a symbolic link added

/libdata/firmware/if_bwfm:
ln -s brcmfmac43455-sdio.raspberrypi,4-model-b.txt "brcmfmac43455-sdio.Raspberry Pi 4 Model B.txt"
to avoid
bwfm0: autoconfiguration error: NVRAM file not available
"
But I get a wrong address range assigned, so not yet solved.

bwfm0: flags=0x8843<UP,BROADCAST,RUNNING,SIMPLEX,MULTICAST> mtu 1500
        ssid [] nwkey *****
        powersave off
        bssid [] chan 11
        address: []
        media: IEEE802.11 autoselect (HT mode 11ng)
        status: active
        inet6 []%bwfm0/64 flags 0 scopeid 0x3
        inet 169.254.x.y/16 broadcast 169.254.255.255 flags 0

Any tips welcome...

Audio/Video

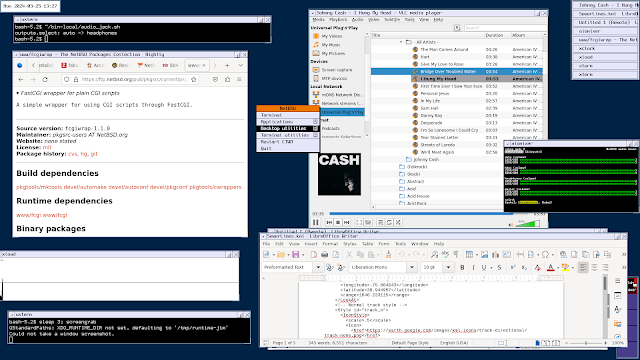
Besides the ubiquitous VLC app (GUI and CLI), I've used mpg123 and mp3blaster on NetBSD systems as command line audio/video players. With a miniDLNA UPnP set-up and steaming internet radio stations I have good tunes at will. In the good old days. a SoundBlaster interface card was the way to go. Theses days, audio circuity is either built-in the system, or ready as easily as popping in a USB dongle. 

Prior versions of NetBSD on Raspberry Pi systems had challenges with the wired headphone circuit and with audio through HDMI (in some cases not the system fault but a lack of speakers in a monitor. The audio streams would play okay for a while but within a day or so various buffer/cache issues came up, causing no sound, or worse, choppy static.

Mar 21 21:59:01 nb4 /netbsd: [ 547447.7922531] audio0(vcaudio0): device timeout

Mar 21 22:07:30 nb4 /netbsd: [ 162.7814073] audio0(vcaudio0): setting play.port=0 failed: errno=22

Controls:

$ /usr/bin/mixerctl -w outputs.select=headphones
outputs.select: headphones -> headphones

$ /usr/bin/mixerctl -v -a
outputs.master=255,255 volume
inputs.dac=255,255 volume
outputs.auto=255,255 volume delta=13
outputs.headphones=255,255 volume delta=13
outputs.hdmi=255,255 volume delta=13
outputs.select=headphones  [ auto headphones hdmi ]

I'm getting about a week of playing, at intervals, before contention creeps in.


Thursday, March 21, 2024

WHERE clause, or FILTER? QGis and small databases

Continuing with getting more QGIS skills, I planned to run the tutorial for changing symbols based on rules or other data conditions. Before I got there, I found a treasure trove of GIS data feeds from the local state government, particularly apt as the sources include property shapes as well as many details on property values. I had looked at the Comptroller's site first only to find the better results on the state planning site.

I had gathered a few data records on specific properties from public information about drinking water wells and mapped a good set of views with QGIS. I was trying not to trace property lines from downloaded imagery and was rewarded for my delay by finding the official records. Of course with caveats, as with any data feed, especially government fed.

I found 4 data sets eventually, 3 as data points and the fourth as polygons. 2 of the 3 point files have  "property" records with one having few columns and the other many; the 3rd has building-specific info.

For my first data loads, I unzipped the procured files then added that data set as a shapefile by telling QGis that the file was the one with the dBASE extension (.dbf). Later I tried point the "Add Layer" file finder at the ZIP file without unpacking the archive and that seemed to work fine. Yay QGis!


Having the data in the GIS console opened many more possibilities. Once I figured out which key column to use (Account ID, go figure) I was able to create a join in QGis. A different experience than mine with database joins with command line SQL scripts, and a bit wrinkly around the edges I'd say.

Part of what I learned in the loading attempts was that source file names might need to be escaped in order to write SQL scripts or filters with QGis itself. The couple files with ASCII/mixed case simply worked with quotes around it. The file name with a Unicode "em dash" on the other hand i struggled with.

SELECT * FROM "public"."CAROparcels0124 — CAROMDPV.shp" LIMIT 10

I worked on creating a view off that table only to hit syntax errors due to bad encoding. I had backslash feedback of multiple kinds "\x0ef" e.g. Eventually I used a connection that maintained the correct characters to record the view definition.

The coolest feature that I found in QGis in this area was being able to drag a locally sourced shape file matrix layer with the GUI and drop it on top of an already open database connection. And hey! The DDL (data definition language) is complete. No scripting, no column defining, just done. I tried to do a screen grab while the create table and insert statements were running, but even with a Raspberry Pi as the "database server."


This showed the stage at 93% complete. I learned to be patient and just let the gears run.

I went back to database filters quickly after checking out QGis filter menu, for performance reasons. If I was looking at a wide area I would want to be able to pan from one small space to another at the price of slow start-up and possibly slow pans as more data are pulled into active stores. On a quick machine you may not notice such sluggishness; for learning purposes I am trying the tutorial lessons on high-ish end x86s and on low-ish end Raspberry Pis. 15,000 records transferred with 100 columns per row is noticeably a lag.

Knowing the data helps decide which fields are filter candidates. In this effort, I recognized some of the columns by their content, not so much their names, and I'll eventually read the data dictionary docs to become more familiar. The interesting ones included kinds of industrial and housing/zoning classification, year structure built and whether a building was on site.

I ended up choosing a political jurisdiction code after trying census tract and looking at other candidates. The first 2 characters are the county, which is constant in the files I pulled, with the next 2 being a district (state level?). That reduced the record counts from 15,000 or so to 3,000, depending on which source file I filtered.

The view definition gets all columns (for simplicity); if I had to, I would look for columns with all NULL or single-values and omit them.

create or replace view carobldg_dist07_v as
select * from "CaroBldg"
where acctid like '0607%'
;

The joins seemed pretty straightforward until I found one property with 2 IDs. Or one ID and 2 property uses. I forget now, and this is my *not to self* to run Pareto over there.

In a later run, the Baltimore County file has 10x what Caroline has, meaning 1/10 the speed in general. Again, character encoding issues.


(~4 minutes for one copy/paste)

> select count(*)  from "BACOparcels0124 \U+00E2\U+0080\U+0094 BACOPOLY.shp"
;
 count  
--------
 233227
(1 row)


2024-03-16T01:02:21     INFO    Task complete : Exporting BACOparcels0124 — BACOMDPV.shp2024-03-16T01:06:08     INFO    Task complete : Exporting BACOparcels0124 — BACOPOLY.shp


And, below, coordinate reference misses; more on that later once I grok the state-provided X-Y pairs.

Below is the Pi4 image of QGis 3.28 on NetBSD 10.0 (RC6).
The log times don't show exactly as I'd like; still looking for any performance logs.
I think that message about shapes is for the data load step, except they aren't in order it seems.

The highlighted area with data details on the right side is part of Baltimore's drinking water supply, showing a border of the City-owned property. Between that 500+ acre parcel is a thin green strip labelled "Loch Raven Reservoir Cooperative Wildlife Management Area."
On the left, I now have a stack of data sources, including "all" of the county info, or a portion via a database view. I'd plan on using the large source, trying different filter logic, and creating more views for the useful fractions.


(Santa, please bring us geoPDF in a future pkgsrc qgis package!)

Monday, March 4, 2024

Screen Scraping GIS Tax Ditch Lines Substandard

Better to get the GIS data someone else has already digitized than to try to digitize from a screenshot. That is what I tried a few months back before I found better source data recently delineating where stormwater drainage goes.

The idea that ditches are taxable, or tax exempt, is still mysterious to me, but we have them in Maryland.

https://geodata.md.gov/imap/rest/services/Agriculture/MD_NutrientManagementSetbacksFromWaterways/MapServer/5

"Description: This is a 35 foot buffer area along PDA ditches where fertilizer applications are restricted on croplands."

A PDA is a "Public Ditch Association." Essentially we've already done the environmental damage cutting down the forests and then terraforming the soil for industrial crop harvests. The ditches stretch for miles in some Eastern Shore counties. Taxes pay for the maintenance, as roadside ditches will fill in with dirt and trash otherwise. 

Initially I found maps showing the ditches, and the surrounding service area, as online maps.


And a map of fire coverage.


One good starting point for "ditches" is https://data.imap.maryland.gov/search?collection=dataset&q=ditch. I followed QGis tutorial lessons [https://docs.qgis.org/3.34/en/docs/training_manual/forestry/stands_digitizing.html], digitizing the above into 2 layers, one for the boundaries and one for the lines. Not very good resolution when you zoom in.


I found, after searching with different criteria, similar tax ditch geo-data in the Maryland State site, and the Eastern Shore collective site. So instead of trying to redo the digitizing effort I could skip that part. 

When I downloaded the shape files, they looked good. But when I tried to pull them into a PostgreSQL database, the points flew somewhere else. I am unsure what was missed. I made a second attempt by downloading a KML file instead of a set of shape files. These lines and areas worked, after a fashion. My PostGIS skills are still pretty fresh, like only this year did I run a local database. 


I experimented with arrows for directions, as this helps visualize the land slope, even if miniscule. There is a great example here: https://docs.qgis.org/3.34/en/docs/training_manual/vector_analysis/network_analysis.html. The "loop" above is an oddity from the ditch crossing the highway intersection. Changing the scale and map view sometimes triggers taffy-pull looking connection lines.

This page has more about rules: https://plugins.qgis.org/planet/tag/thematics/.

Next step for me is altering the labels so that roads are distinct from ditches, because there is both a Chicken Bridge Road and a Chicken Bridge drainage area/network. 


Tuesday, February 20, 2024

Well Sample Data and GIS Development

 I looked at water quality tests for a few private wells in Maryland to be able to better use GIS tools. After reviewing public information I took note of key fields such as well depth. In order to show connections among the various aspects I started an entity relationship diagram, going from basic SQL to end up with 8 tables.


In order to keep consistent a few constraints were included, such as:


ALTER TABLE

  well

ADD CONSTRAINT

  well_fkey_property

FOREIGN KEY

  (property_fk)

REFERENCES

  property(name)

;


  I decided to connect wells to a property, and buildings likewise. Normally one well is allowed per property, though while a replacement is being drilled one property might have 2 wells, and if a well runs dry you might say the property has no well.

 The old forms (pre-2000?) have Maryland grid coordinates, with accuracy to 1,000 feet, while the newer forms have a place for latitude/longitude. Water quality tests done by commercial lab contain values of constituents ranging from coliform bacteria to lead and arsenic.

 Sometimes the applications have typos.


Oops, mixed up east and north. I did the same when I first tried to load point data into GIS; once I noticed the drift and switched the values the wellhead came online where it should be.

 After the table definitions and test data load I used the QGis example tutorials to include the bits required for my hand-curated data to be mapped correctly.

See: 
https://docs.qgis.org/3.28/en/docs/training_manual/spatial_databases/simple_feature_model.html
https://docs.qgis.org/3.28/en/docs/training_manual/spatial_databases/geometry.html

> insert into geometry_columns values ('','public','well','the_geometry',2,4326,'POINT');

> update well set the_geometry = 'SRID=4326;POINT(-75.882996 38.938629)' where name = 'CO-15-0020' ;


An 8-way join, or is 7-way?

select
  r.value ,                             -- value
  r.uom,                                -- units
  p.name as name_p,                     -- param
  substr(r.name,1,12) as name_r,        -- result
  s.well_fk as well,                    -- well
  s.name as name_s,                     -- sample
  substr(s.sample_place,1,4) as place,  --
  substr(p.descr,1,10) as param_desc,   --
  substr(c.name,1,8) as name_c,         -- corp
  w.depth,                              -- well
  w.pump_installed as pump,             -- well
  substr(o.lot,1,10) as lot,            -- prop
  e.name as person,                     -- people
  s.sample_date
from
  people e,
  building b,
  lab_corp c,
  lab_sample s,
  lab_sample_results r,
  parameter p,
  property o,
  well w
where
  e.building_fk = b.name     -- people in building
and
  b.property_fk = o.name     -- building on property
and
  s.well_fk = w.name         -- sample from well
and
  w.property_fk = o.name     -- well on property
and
  r.parameter_fk = p.name
and
  r.lab_sample_fk = s.name
and
  s.lab_corp_fk = c.name
;


What have I accomplished? Now I have environmental data in a reachable database, which I can edit via command line, or even using LibreOffice forms, and now view and update via QGis.
Next I will figure out the step up from points data (the well heads) to polygons (property lines and building walls). Then, with sample data, set up views with contaminant levels on the map.


Looks a lot like dBASE IV, right? 

Sunday, February 4, 2024

Turning "Meats and Bounds" into a Map

I came across a section of a scanned municipal blueprint, finding an inset map labelled with "Meats & Bounds", an obvious misspelling of the surveying phrase "Meets & Bounds", the term for property boundary descriptions in a specific style.


As I wanted to learn more about the town boundaries for equity reasons I also wanted to continue my journey learning how to use QGIS and related tools. In the QGIS tutorials, I found ways to bring shape files into a PostGIS database, and export shape files from the database. This might be elementary to some, and obscure to others. My notes that follow are the steps I took to go from a relatively simple property boundary (a rectangle) into digital formats, with comments on accuracy or lack thereof.

It turns out the description of the original town boundaries are encapsulated in state law or regulations, https://mgaleg.maryland.gov/Pubs/LegisLegal/Muni-Charters/2019-municipal-charter-ridgely.pdf 

Beginning at a point where the center of Central Avenue intersects the center of Pennsylvania Railroad tracks and running with the center of said tracks in a northeasterly direction one–half mile to point in center of said tracks, which said point shall be the beginning for the outlines of said corporation;

The Pennsylvania Railroad has not existed as a corporation for decades, and the tracks through the town are pulled up in places and turned into hiking and biking trails, making the "center of said tracks" less obvious now than it was in 1937.

I began by running Viking on NetBSD 10 (RC3) to create points and lines. I tried both kilometer and mile markers, wishing for feet and yards given passages such as "parallel with Central Avenue forty–eight hundred and seventy–five feet." 


Eyeballing the distances and bearings, I came out close to the starting rectangle edge, though clearly not a professional surveying effort.


I exported the waypoint (Origin) and the tracks as lines 1 through 6. With these files loaded into Google Earth Pro via a KML format, I found the shapes where I expected them, off a bit from OpenStreetMap boundaries, but not too bad for a first try. To simplify the shape, I drew a rectangle/polygon, then loaded that into QGis as a vector layer.


You can see the "miss" on the lower left corner of the municipal boundary. Half a city block, or less...

To go further, I exported the shape from QGis into the 5-sided Esri shape folder, then brought the result into a PostGIS database following the tutorial steps: https://docs.qgis.org/3.28/en/docs/training_manual/spatial_databases/import_export.html


The shape looks like the one above (as it should); the database columns include the renamed "description" as "descriptio".

Warning 1: Field Name of width 255 truncated to 254.
Warning 6: Normalized/laundered field name: 'Description' to 'Descriptio'
Warning 1: Field Descriptio of width 255 truncated to 254.

Now I can load the same shapes into different QGs versions (Windows/BSD/Linux) and not worry about "version too old/new" messages.

Monday, January 22, 2024

Revamp Unboxing SAP Community 2024

The SAP Community site revamp of 2024 is ongoing and promises to be unveiled Tuesday so here are my predictions on Monday.

At the moment blog reads increment on reload questions do not. Implying more work on the latter.  We'll lose all previous read page counts and start from 0. Links to other community members will be about as correct as a week ago.

Questions may be stricken from the record. I bookmarked 2 to see if they make the cut. Criteria were established in the plan where irrelevant topics get purged, and as the TOC reads, SAP at their sole discretion may delete any content. No takebacks.

Broken links and missing images are likely. Like other platform changes, fix or tape over. I know I missed the chance to tag my hundreds of posts, always expecting some algorithm to do it for me.

Blogs that were planned for demolition has a stay of execution so no one should vanish. The "just JSON plan" faltered in the light of day. I had already planned my own recovery process.

When we thought some posts would vanish, I ran a mini project to archive.org my own posts.


Some had been snapped before, some not. Questions might be archived but I didn't look hard except for a couple test samples and a review of the answer thon.


Bio pages were to be revamped, but before the read-only phase started were skeletal or minimal.

Messages and inboxes are a mess, as are contacts given prior art. Remains to be seen how much previous net connections need to be renewed.

What to expect?

Community members will begin to engage in the new space, or decide to skip town. Leader boards and gamiification only go so far.

Search engine optimization will be improved. After the "deadwood" gets flushed from the search caches, which takes time.

Blogs posts will be slower than before given potential permission changes, and the tool belt shuffle going from Word Press to Not Word Press. I am particularly interested in the finer points of code and text snippet displays once I saw a bit of the HTML differences.